From the Series
As it stands, there are 22.5 million recorded refugees in the world. According to UNHCR, the majority leave countries like South Sudan, Syria and Afghanistan, and find asylum in countries like Turkey, Pakistan and Lebanon.
There are real people behind these statistics – a fact that often goes unmentioned in talks of immigration crackdowns and travel bans.
Sometimes a form of creative expression can bring these real-life narratives to the fore. This was the case in 1985 when what would become iconic photograph called Afghan Girl featured on the cover of the National Geographic.
The image of an adolescent girl with green eyes in a red headscarf looking intensely at the camera captured the hearts and minds of many.
Information designer Ekene Ijeoma sought to look beyond the frames of that photograph with the Refugee Project, an interactive map which allows users to track the movement of refugees from 1975 to present day. He paired this data with over 100 refugee stories, giving viewers insight into the lives of these people.
“That’s when I realised that data can be beautiful but also insightful and also that data visualisation and design could actually break the news cycle,” he said during his presentation at the Design Indaba Conference 2017.
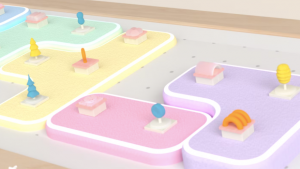
In another project, Wage Islands, Ijeoma created a 3D installation that displayed the affordable housing crisis in New York, reframing the narrative on minimum wage workers.
“I wanted to do that by just showing where they [minimum wage workers] can live in New York city and also question, will people who are building and servicing the city be able to live in the city?”
Watch the Design Talk to see more of Ijeoma’s experiential data projects.
These interviews are brought to you by Liberty and inspired by the Design Indaba Conference 2017.
Create. Share. Inspire.


