From the Series
The crime rate in Finland may not inspire fine dining at your average restaurant but for the experimental chefs of Data Cuisine, information informs every signature dish. An initiative by data visualizer Moritz Stefaner and prozessagenten, process by art and design, Data Cuisine explores ways to approach data and the stories behind it by cooking up signature menus.
The program runs multiple workshops in Leeuwarden, Basel, Barcelona, and Helsinki. Participants in these workshops are called on to create dishes based on questions like: “Have you ever tried to imagine how a fish soup tastes whose recipe is based on publicly available local fishing data? Or what a pizza would be like if it was based on Helsinki’s population mix?”
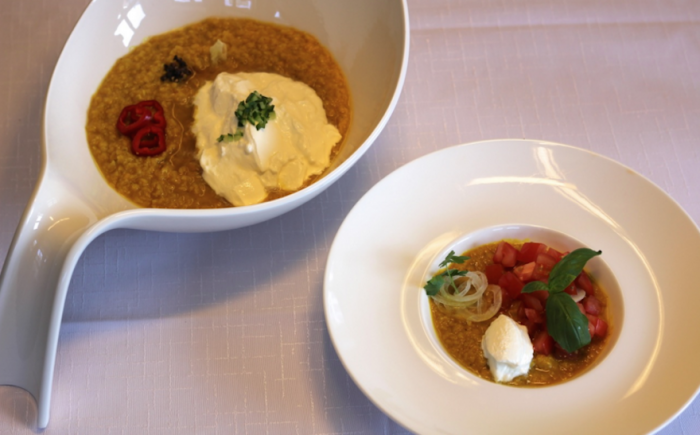
The result is the creation of dishes like Age & Language in Lentils, which is the representation of the median age, population size and languages spoken in the US and Italy.
“For instance, the number of English speaking people is represented by the amount of Yoghurt, while tomatoes with basil stands for the Italian speaking population. The number of lentils symbolizes overall population size and the “doneness” of the lentils represents median age,” reads the website.
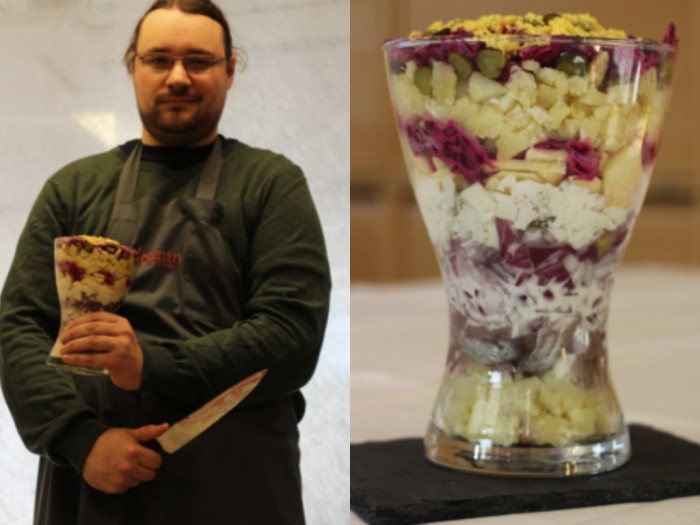
In Criminal Herring in Fur Coat, the food designers looked at Finland’s crime rates in 2011 and represented the stats in a “criminally” stacked Russian salad. Each layer represents one type of crime.
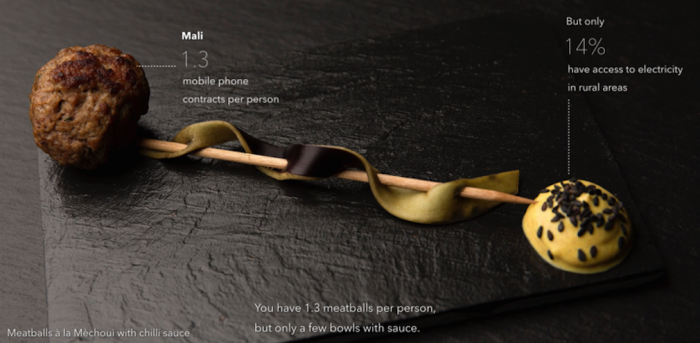
In another slightly odd data visualisation, the chefs considered that in Mali, there are on average 1.3 mobile phones contracts per person but only 14% actually have access to electricity. To explore this, the chefs made 260 meat skewers for 200 guests — that is an average of 1.3 skewers per person, which equals the number of mobile phone contracts per person in Mali.
“In order to plug in your “cell phone”, you had to go on a hunt for the delicious dip. We placed the dips only at a few spots, so you can feel like a true Malian who is looking for an electricity plug in a rural area,” reads the program’s website.


