
First Published in
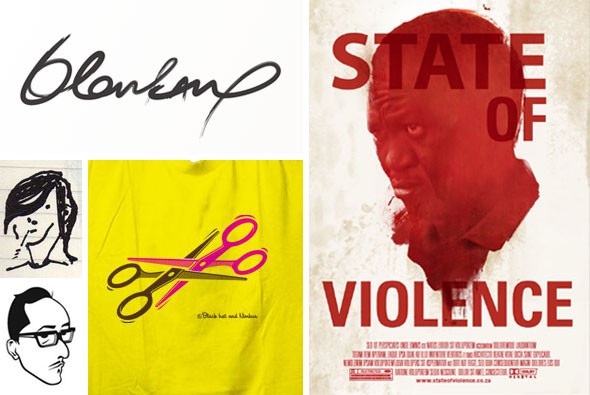
Lesser creative ventures have been initiated by the need for expression, money or trendiness. However, for Hannah Williams and Mark Henning of Black Hat and Nimbus, it was their belief that design can make a tangible difference in day-to-day life that that led the duo to setting up their Cape Town studio in October 2010.
Design should not just be appealing, Henning says: “Design should serve a purpose. We’re not artists that create work to deal with our inner angst. We’re designers that solve problems and look for a practical outcome … We live in a country where there is a big imbalance and we want to get involved and use our skills productively.”
“It’s not like we can build a house because our house-building skills aren’t that great, but we can design stuff,” adds Williams wryly.
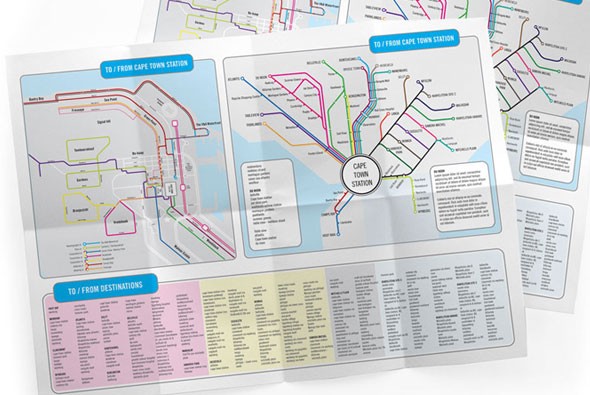
Having moved from Johannesburg to the Mother City, Henning found that using minibus taxis to move around the city was very convenient, barring the fact that there was no form of wayfinding for the countless taxi routes. Recognising this as a problem that a design solution could address, Henning and Williams started pro-actively working on designing a truly integrated public transport map for Cape Town that included minibus taxi routes.
This labour of love soon became all consuming, but as they both had day jobs at the time, it became difficult to dedicate sufficient time to the project. “The main reason we started Black Hat and Nimbus was to focus on our transport mapping project,” Henning explains. But designing route maps and way-finding materials raised a number of design questions for Williams and Henning.
“We knew that this couldn’t just be a copy-and-paste job from Europe,” says Williams. “First we had to ask whether the people we are designing for understand how to read a map and consider their visual literacy. It’s important to consider visual language and literacy specific to the South African context. And the fact that English is not necessarily everybody’s first language.”
A key interest area, Henning believes that mobility is important because it gives people freedom. “While doing research I discovered that a lot of people only really know how to get from their house to work but this is limiting because they don’t know how else to move around and interact with the city.”
Williams adds to this, pointing out that a good transport map for a city lays the foundation for better urban planning. “How you communicate with the public should be part of the fundamental considerations, along with building the infrastructure, communication should be prioritised. Design is increasingly the interface between us and our urban environments.”
Unfortunately, months of work and countless meetings later, the taxi project has been temporarily put on hold. Despite being disappointed by the bureaucracy and lack of enthusiasm on the part of the city, they see the project as only the beginning of something much larger.
The maps have also served to promote their commercial work, while still asserting their design motivations, resulting in commissions for less traditional urban design projects. For instance, they are currently collaborating with Ismail Farouk, a Cape Town artist and urban geographer, on a public art project for the city of Ghent, Belgium. The goal of the piece is to create a more inclusive and integrated public space.
Another opportunity to explore the role of design within the urban context was the commission from the City of Cape Town earlier this year to create artworks on the Integrated Bus Rapid Transit System’s West Coast route stations. Although it was primarily an art project, they felt they wanted to do more than just “make pretty pictures”.
Wanting to create a point of interaction between the commuters and the areas they were travelling through, they designed infographics that highlight curious information relating to each station’s surroundings. The result is a range of data visualisations, from the more serious graphic showing Woodstock’s changing population demographics to a tongue-in-cheek comparison between ships coming into Cape Town harbour and local Lotto winnings – a play on the saying “when my ship comes in”.
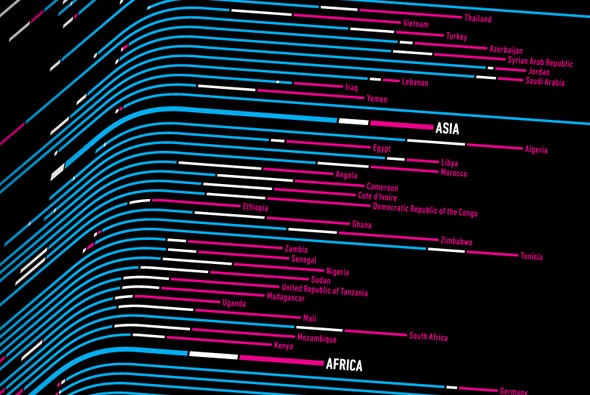
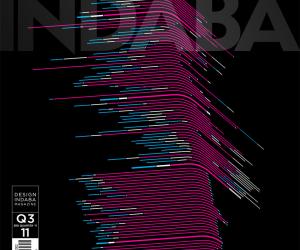
Designing the cover for the “Metropolis” edition of Design Indaba magazine allowed them another opportunity to explore the aesthetics of information. “And you can read more into it at the same time,” winks Henning while talking about how their visualisation of the world’s projected urbanisation until 2050 looks as though the future is dropping off into a gutter.


